Table of Contents

Nothing Above you: (You’re home.)

 Same level as (red) current page

Below the page you’re on:

Coronavirus: Exponential Predictions

Good News: Social distancing is working. You can see the effects in the 2nd graph below that has been updated through March 29. It doesn’t look like much yet, but that is because the special method of graphing compresses the huge impacts of exponential growth. Check for a new model that will be posted by early Tuesday here.

Viruses spread exponentially fast, until something slows them down. That’s not just a figure of speech, it’s math. Exponential growth means growing by the same percent every day. From March 1 (88 cases) through March 18 (8,317 cases) Covid-19 cases increased by about 30% each day. So in that time it got 95 times worse. It’s on track to do that again.

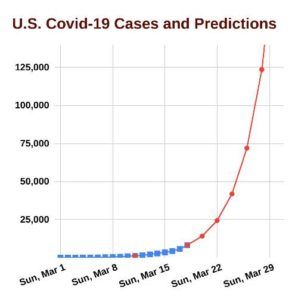
The figure above shows what exponential growth looks like. The blue part is what happened through Mar. 18, and the red part shows the predictions. But looking at the blue part it’s impossible to tell if those predictions are really where the blue squares are headed, even for 10 days of predictions.

Scientist and engineers use a special kind of graph that solves this problem. As you move up the vertical axis, instead of the numbers going up by the same amount from level to level, they get 10 times bigger each time you go up a level. E.g. instead of going 10, 20, 30, they go 10, 100, 1000. That does a sort of mathematical magic trick on exponential growth. If you plot any truly exponential growth on that kind of graph paper, no mater how fast or slow the growth, you get a straight line! (Faster growth = steeper line.)

It’s very easy to see were a straight line is going. And if the line is not straight you know it’s not exponential growth. So to test if Covid-19 is growing exponentially and to see where it’s going, I plotted it on this special “logarithmic” graph. And here’s how it looks.25

The blue squares are the number of cases at the end of each day according to the NY Times. As you can see, these are following a remarkably straight path, so the growth in Covid-19 cases really is exponential. (Let’s hope something like social distancing slows it down soon and the line bends.)

The red line and red dots reaching beyond the blue squares are predictions. These are made by drawing a straight line through the last blue-square data-point and one a week earlier (the one with the red dot in it). As you can see, after 14 days, the cases will increase from 18,000 to just over a million.

Unless we do a good job with social distancing, testing and quarantining,  here are a few other predictions that will be all too close to true.

As things are going, our hospitals will soon be overwhelmed.

What we must do is reduce the transmission rate. That’s the average number of people that each person who gets the virus infects. The current growth rate can be explained by a transmission rate of one to four (1⇒4) if the contagion all happens five days after a person first catches the virus. Five days is about how long it takes to first feel the symptoms. 

Some contagion can happen a day or two sooner, but some must be happening later. So a five-day delay seems like it can’t be high by much. And this means the transmission rate can not be much less than 1⇒4.

Herd Immunity. After half the population has had Covid-19, the transmission rate is cut in half. This will be a huge help, but the price is extremely high. With a 1% mortality rate, that means 1.5 million will die by the time we get there. And that still won’t stop more people from getting infected, but it might after a few more months.

Drastic Action Now. If the steady rate of exponential growth that has been going on for 18 days, continues for four more weeks, 150,000 will die, even if the virus stops spreading the next day. There’s no time to waste. This is war.

Here’s the data and model that I use.

Data comes from the NY Times

Most informative video

Week-ahead predicted cases compared to actual cases

Share

Follow zFacts on FB

Ripped Apart

The nation is ultra-polarized and that’s killing democracy and dragging the Democrats down. But did you know:

  • Ultra-left Democrats are accidentally helping Trumpism?
  • Their ideals are good but…
  • They’ve been mislead

Their conspiracy theories and slanders are spreading inside the party.  Reading this, people say: I knew that sounded wrong. Now I know why.

Buy on Amazon. Download free PDFs (no catches)

0 0 votes
Article Rating
Subscribe
Notify of
guest

This site uses Akismet to reduce spam. Learn how your comment data is processed.

0 Comments
Inline Feedbacks
View all comments
0
Would love your thoughts, please comment.x
()
x

Table of Contents

Nothing Above you: (You’re home.)

 Same level as (red) current page

Below the page you’re on: